 I'm a tech professional (ex-Amazon) with experience including software engineering, and management. Currently living in NYC.
 Raspberry Pi Monitoring with EZ Server Monitor

Install NGINX
EZ Server Monitor needs a webserver, and the one we’ll be using is NGINX. For more information about installing NGINX, follow my NGINX installation guide for the Raspberry Pi.
Install EZ Server Monitor
Once NGINX is installed, add these lines to our virtual host config file (found here /etc/nginx/sites-enabled/default) to protect the ./conf/esm.config.json config file:
location ~ /(conf)/ {
    deny all;
}
First cd into the root websites folder
cd /var/www/html
then download, unzip the folder, and remove original .zip file
sudo wget --content-disposition http://www.ezservermonitor.com/esm-web/downloads/version/2.5
unzip ezservermonitor-web_v2.5.zip
sudo rm ezservermonitor-web_v2.5.zip
Since we want EZ Server Monitor’s UI to appear under the /monitoring URL of our Pi, rename the folder
mv eZServerMonitor-2.5/ monitoring/
Now, if you go to the hostname of your Pi /monitoring (ex: http://pi1.local/monitoring/) you should now see the EZ Server Monitor dashboard.
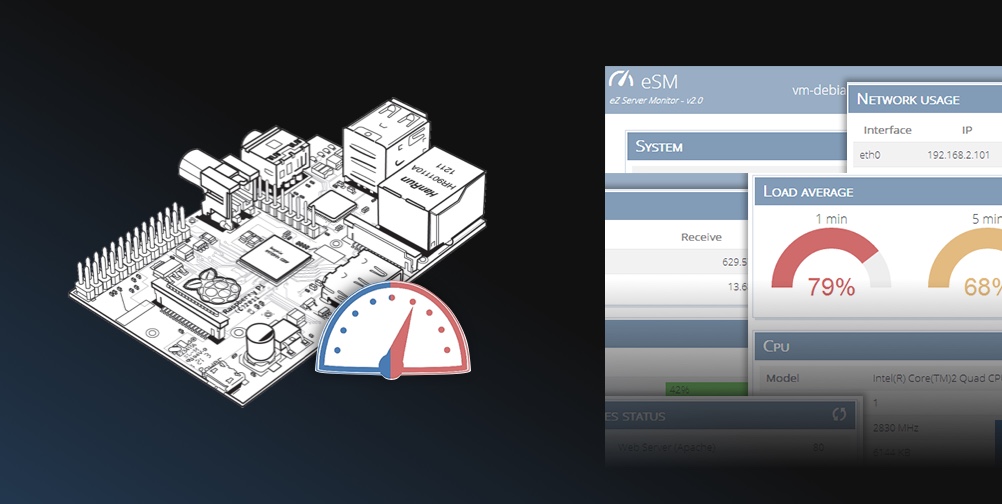
Try stress testing your Raspberry Pi and watching the dashboard. When I first installed this dashboard, I saw load averages of 0% across the board which lead me to belive that part of the dashboard was broken. This was not the case as the Raspberry Pi was simply not under load until I ran a stress test.
Customize EZ Server Monitor
You can customize the configuration of the monitoring dashboard by modifying the config file. Since we installed EZ Server Monitor under the /monitoring folder in the Nginx website root, we can find the file here:
nano /var/www/html/monitoring/conf/esm.config.json
For more information about customization see the official documentation
